
Protein:ABCG5 |
Protein Summary |
 Gene summary Gene summary |
| Gene name: ABCG5 | ASpdb.0 ID: 64240 | Gene | Gene symbol | ABCG5 | Gene ID | 64240 |
| Gene name | ATP binding cassette subfamily G member 5 |
| Synonyms | STSL|STSL2 |
| Cytomap | 2p21 |
| Type of gene | protein-coding |
| Description | ATP-binding cassette sub-family G member 5ATP-binding cassette, sub-family G (WHITE), member 5sterolin 1 |
| Modification date | 20240416 |
| UniProtAcc | Q9H222 |
| Gene ontology of this gene with evidence of Inferred from Direct Assay (IDA) from Entrez |
| Partner | Gene | GO ID | GO term | PubMed ID |
| Gene | ABCG5 | GO:0005524 | ATP binding | 16893193 |
| Gene | ABCG5 | GO:0016887 | ATP hydrolysis activity | 16893193 |
| Gene | ABCG5 | GO:0042626 | ATPase-coupled transmembrane transporter activity | 27144356 |
| Gene | ABCG5 | GO:0043190 | ATP-binding cassette (ABC) transporter complex | 16893193|27144356 |
| Gene | ABCG5 | GO:0043235 | receptor complex | 14504269 |
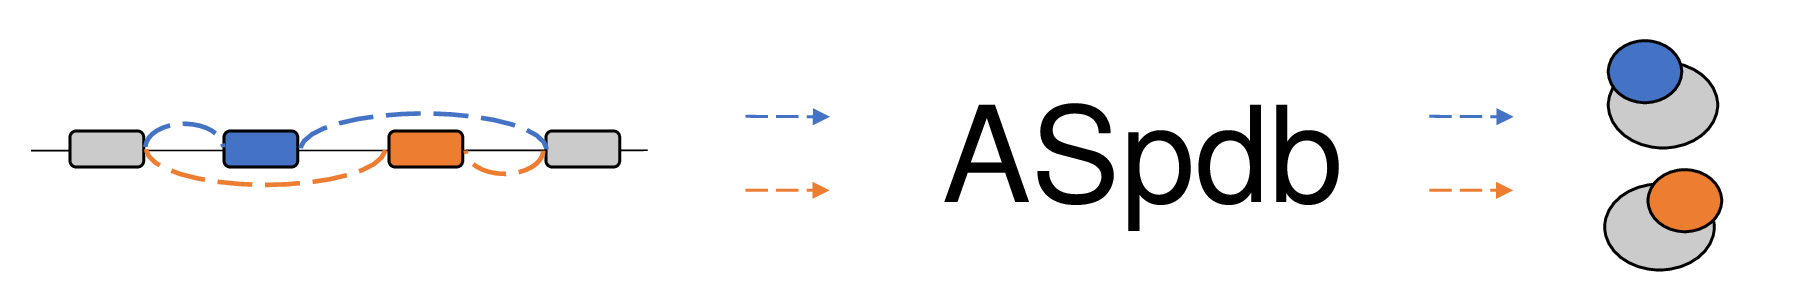
AS Summary |
| Information of the canonical protein with experimentally identified structure from PDB (2023). |
| UniProt Acc | File name | PDB ID | Method | Resolution | Chain | Start | End |
| Q9H222-1 | Q9H222-1_5do7_A.pdb | 5DO7 | X-ray | 3.93 | A | 34 | 650 |
| ASpdb's canonical and alternatively spliced isoform information. |
| accession_id | gene_name | canonical_id | alternative_id | canonical_length | alternative_length | canonical_start | canonical_end | type | originalSEQ | variationSEQ | alternative_start | alternative_end |
| Q9H222 | ABCG5 | Q9H222-1 | Q9H222-2 | 651 | 256 | 1 | 395 | Deletion | none | none | 0 | 0 |
| Multiple sequence alignment of our canonical and alternatively spliced ABCG5 |
| Matched gene isoform IDs with Ensembl and RefSeq of our canonical and alternative spliced genes of ABCG5 |
| UniProt-id | ENSG | ENST | ENSP |
| Q9H222-1 | ENSG00000138075.14 | ENST00000405322.8 | ENSP00000384513.2 |
| UniProt-id | NM ID | NP ID |
| Q9H222-1 | NM_022436.2 | NP_071881.1 |
| Amino acid sequences of our canonical and alternatively spliced ABCG5 |
| accession_id | Protein sequence |
| Q9H222-1 | MGDLSSLTPGGSMGLQVNRGSQSSLEGAPATAPEPHSLGILHASYSVSHRVRPWWDITSCRQQWTRQILKDVSLYVESGQIMCILGSSGS GKTTLLDAMSGRLGRAGTFLGEVYVNGRALRREQFQDCFSYVLQSDTLLSSLTVRETLHYTALLAIRRGNPGSFQKKVEAVMAELSLSHV ADRLIGNYSLGGISTGERRRVSIAAQLLQDPKVMLFDEPTTGLDCMTANQIVVLLVELARRNRIVVLTIHQPRSELFQLFDKIAILSFGE LIFCGTPAEMLDFFNDCGYPCPEHSNPFDFYMDLTSVDTQSKEREIETSKRVQMIESAYKKSAICHKTLKNIERMKHLKTLPMVPFKTKD SPGVFSKLGVLLRRVTRNLVRNKLAVITRLLQNLIMGLFLLFFVLRVRSNVLKGAIQDRVGLLYQFVGATPYTGMLNAVNLFPVLRAVSD QESQDGLYQKWQMMLAYALHVLPFSVVATMIFSSVCYWTLGLHPEVARFGYFSAALLAPHLIGEFLTLVLLGIVQNPNIVNSVVALLSIA GVLVGSGFLRNIQEMPIPFKIISYFTFQKYCSEILVVNEFYGLNFTCGSSNVSVTTNPMCAFTQGIQFIEKTCPGATSRFTMNFLILYSF |
| Q9H222-2 | MGLFLLFFVLRVRSNVLKGAIQDRVGLLYQFVGATPYTGMLNAVNLFPVLRAVSDQESQDGLYQKWQMMLAYALHVLPFSVVATMIFSSV CYWTLGLHPEVARFGYFSAALLAPHLIGEFLTLVLLGIVQNPNIVNSVVALLSIAGVLVGSGFLRNIQEMPIPFKIISYFTFQKYCSEIL |
Protein Functional Features |
| Main function of this protein. (from UniProt) |
| ABCG5 (go to UniProt):Q9H222 |
| Retention analysis result of protein across 39 protein features of UniProt such as six molecule processing features, 13 region features, four site features, six amino acid modification features, two natural variation features, five experimental info features, and 3 secondary structure features. Here, because of limited space for viewing, we only show the protein feature retention information belong to the 13 regional features. All retention annotation result can be downloaded at * Minus value of BPloci means that the break pointn is located before the CDS. |
| - Retained protein feature among the 13 regional features. |
| Accession_id | Subsection | Start | End | Funcitonal feature | Splicing information |
| Q9H222 | Topological domain | 1 | 383 | Note=Cytoplasmic;Ontology_term=ECO:0000269;evidence=ECO:0000269|PubMed:27144356;Dbxref=PMID:27144356 | Type=Deletion;Start=1;End=395 |
| Q9H222 | Transmembrane | 384 | 404 | Note=Helical%3B Name%3D1;Ontology_term=ECO:0000269;evidence=ECO:0000269|PubMed:27144356;Dbxref=PMID:27144356 | Type=Deletion;Start=1;End=395 |
| Q9H222 | Domain | 52 | 293 | Note=ABC transporter;Ontology_term=ECO:0000255;evidence=ECO:0000255|PROSITE-ProRule:PRU00434 | Type=Deletion;Start=1;End=395 |
| Q9H222 | Domain | 388 | 645 | Note=ABC transmembrane type-2 | Type=Deletion;Start=1;End=395 |
| Q9H222 | Region | 1 | 32 | Note=Disordered;Ontology_term=ECO:0000256;evidence=ECO:0000256|SAM:MobiDB-lite | Type=Deletion;Start=1;End=395 |
| Q9H222 | Compositional bias | 1 | 28 | Note=Polar residues;Ontology_term=ECO:0000256;evidence=ECO:0000256|SAM:MobiDB-lite | Type=Deletion;Start=1;End=395 |
Gene Isoform Structures and Expression Levels for ABCG5 |
| Gene structures of our canonical and alternative spliced genes of ABCG5 * Click on the image to open the UCSC genome browser with custom track showing this image in a new window. |
| Expression levels of gene isoforms across GTEx. |
 |
| Expression levels of gene isoforms across TCGA. |
 |
Protein Structures |
| PDB and CIF files of the predicted protein structures * Here we show the 3D structure of the proteins using Mol*. AlphaFold produces a per-residue confidence score (pLDDT) between 0 and 100. Model confidence is shown from the pLDDT values per residue. pLDDT corresponds to the model’s prediction of its score on the local Distance Difference Test. It is a measure of local accuracy (from AlphfaFold website). To color code individual residues, we transformed individual PDB files into CIF format. |
| 3D view using mol* of Q9H222-1 |
| 3D view using mol* of Q9H222-2 |
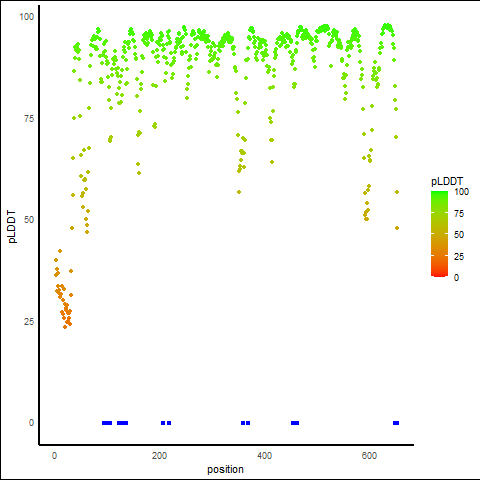
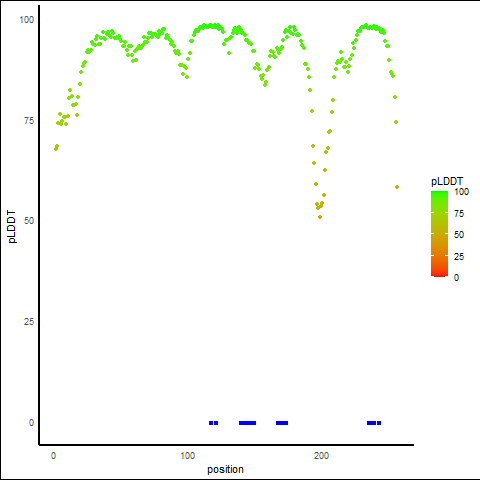
pLDDT Score Distribution |
| pLDDT score distribution of the predicted protein structures from AlphaFold2 * AlphaFold produces a per-residue confidence score (pLDDT) between 0 and 100. |
| pLDDT distribution across the protein length of Q9H222-1 |
 |
| pLDDT distribution across the protein length of Q9H222-2 |
 |
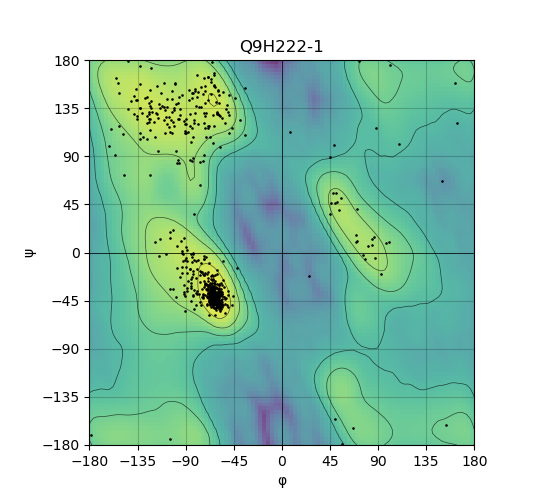
Ramachandran Plot of Protein Structures |
| Ramachandran plot of the torsional angles - phi (φ)and psi (ψ) - of the residues (amino acids) contained in this protein peptide. |
| Ramachandran plot of Q9H222-1 |
 |
Potential Active Site Information |
| The potential binding sites of these proteins were identified using SiteMap, a module of the Schrodinger suite. |
| UniProt-id | Site score | Size | D score | Volume | Exposure | Enclosure | Contact | Phobic | Philic | Balance | Don/Acc | Residues |
| Q9H222-1 | 1.017 | 116 | 1.05 | 427.721 | 0.692 | 0.694 | 0.801 | 0.313 | 0.941 | 0.332 | 1.091 | 93,97,100,101,102,103,105,122,123,125,126,129,130, 131,133,134,206,217,357,367,453,454,455,456,458,45 9,460,646,647,649,650,651 |
| Q9H222-2 | 0.925 | 43 | 0.986 | 145.775 | 0.583 | 0.718 | 0.993 | 2.788 | 0.187 | 14.893 | 2.099 | 117,121,139,142,143,145,146,149,167,170,171,172,17 3,235,238,239,242 |
Protein Structure and Feature Comparision |
| Protein Structure Comparision Using Template Modeling Scores (TM-score). |
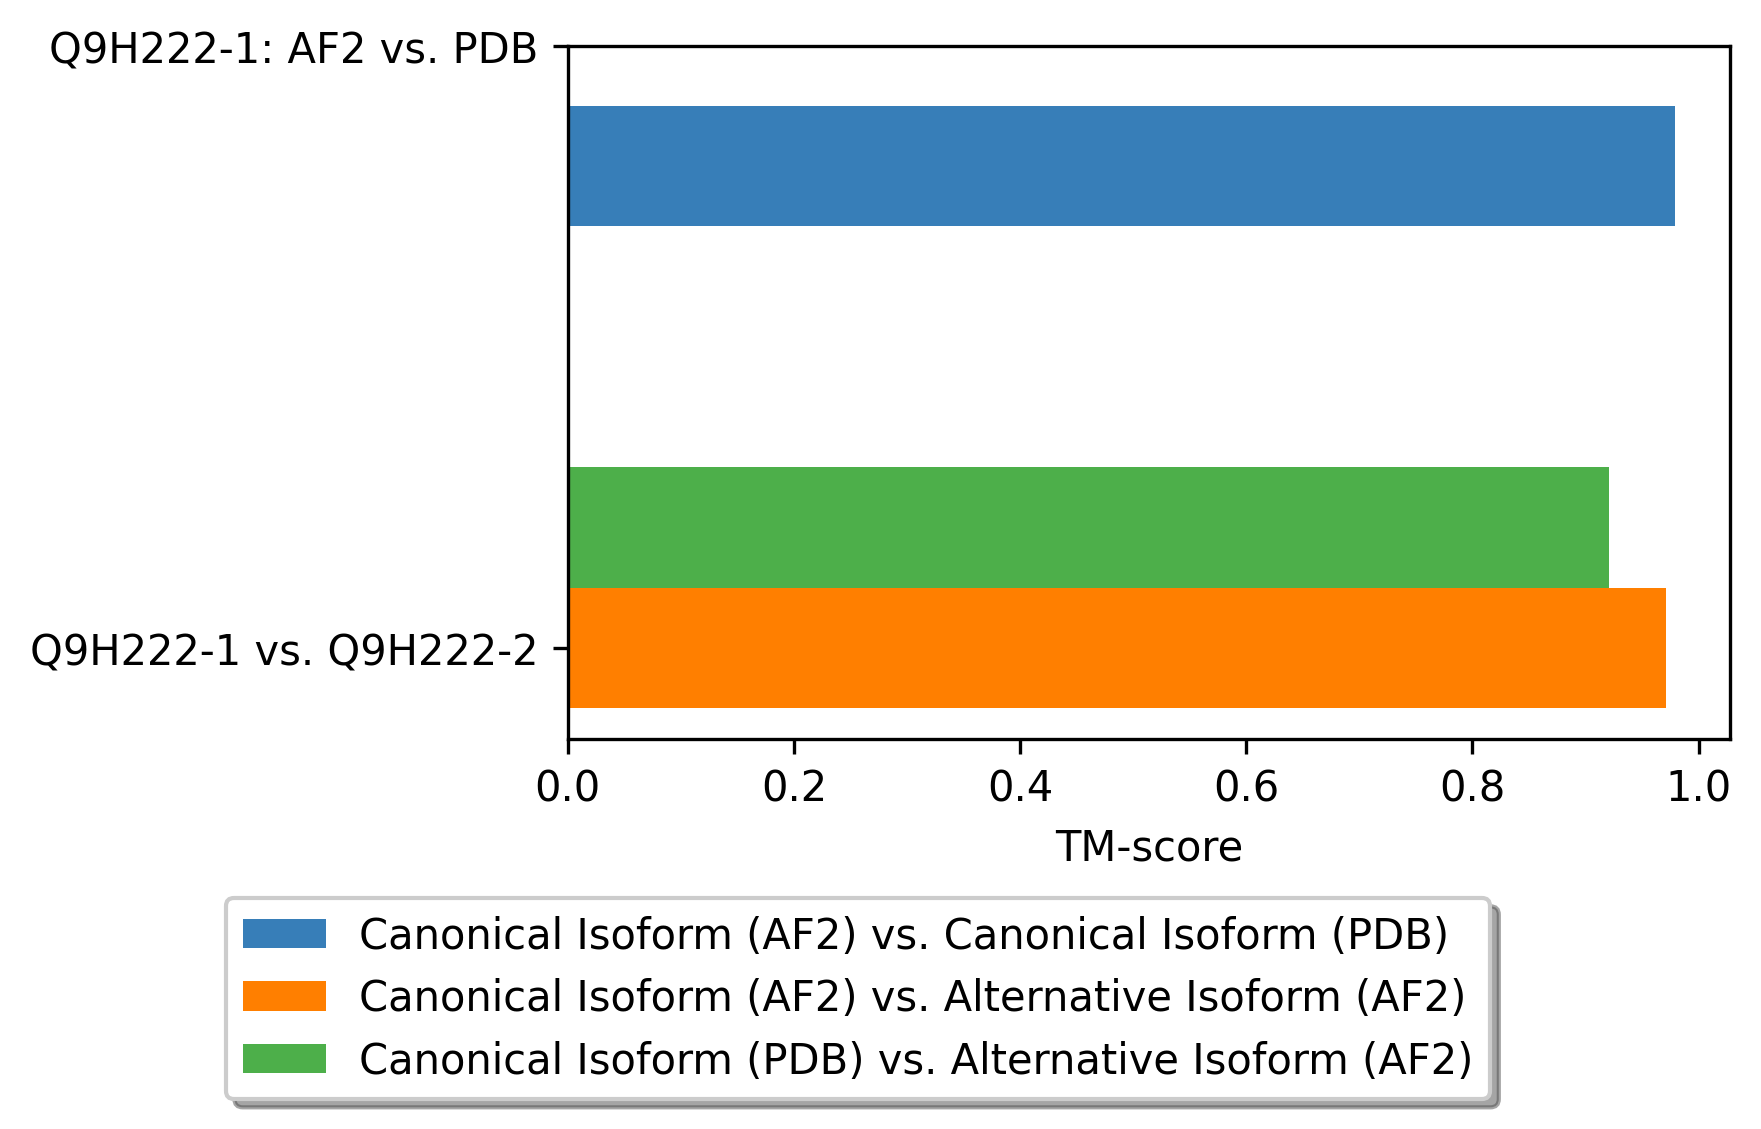 |
| Protein Structure Comparision Visualization with mol*. between Canonical predicted structure (AF2)(orange) vs Canonical validated structure (PDB)(green) |
| 3D view using mol* of Q9H222-1_Q9H222-1_5do7_A.pdb |
| Protein Structure Comparision Visualization with mol*. between Canonical validated structure (PDB)(orange) vs Alternative predicted structure (AF2)(green) |
| 3D view using mol* of Q9H222-1_5do7_A_Q9H222-2.pdb |
| Protein Structure Comparision Visualization with mol*. between Canonical predicted structure (AF2)(orange) vs Alternative predicted structure (AF2)(green) |
| 3D view using mol* of Q9H222-1_Q9H222-2.pdb |
| Protein Feature Comparison of the protein sequendary structures among the protiens. |
| ./stats/secondary_structure/figure/Q9H222-1_vs_Q9H222-2.png |
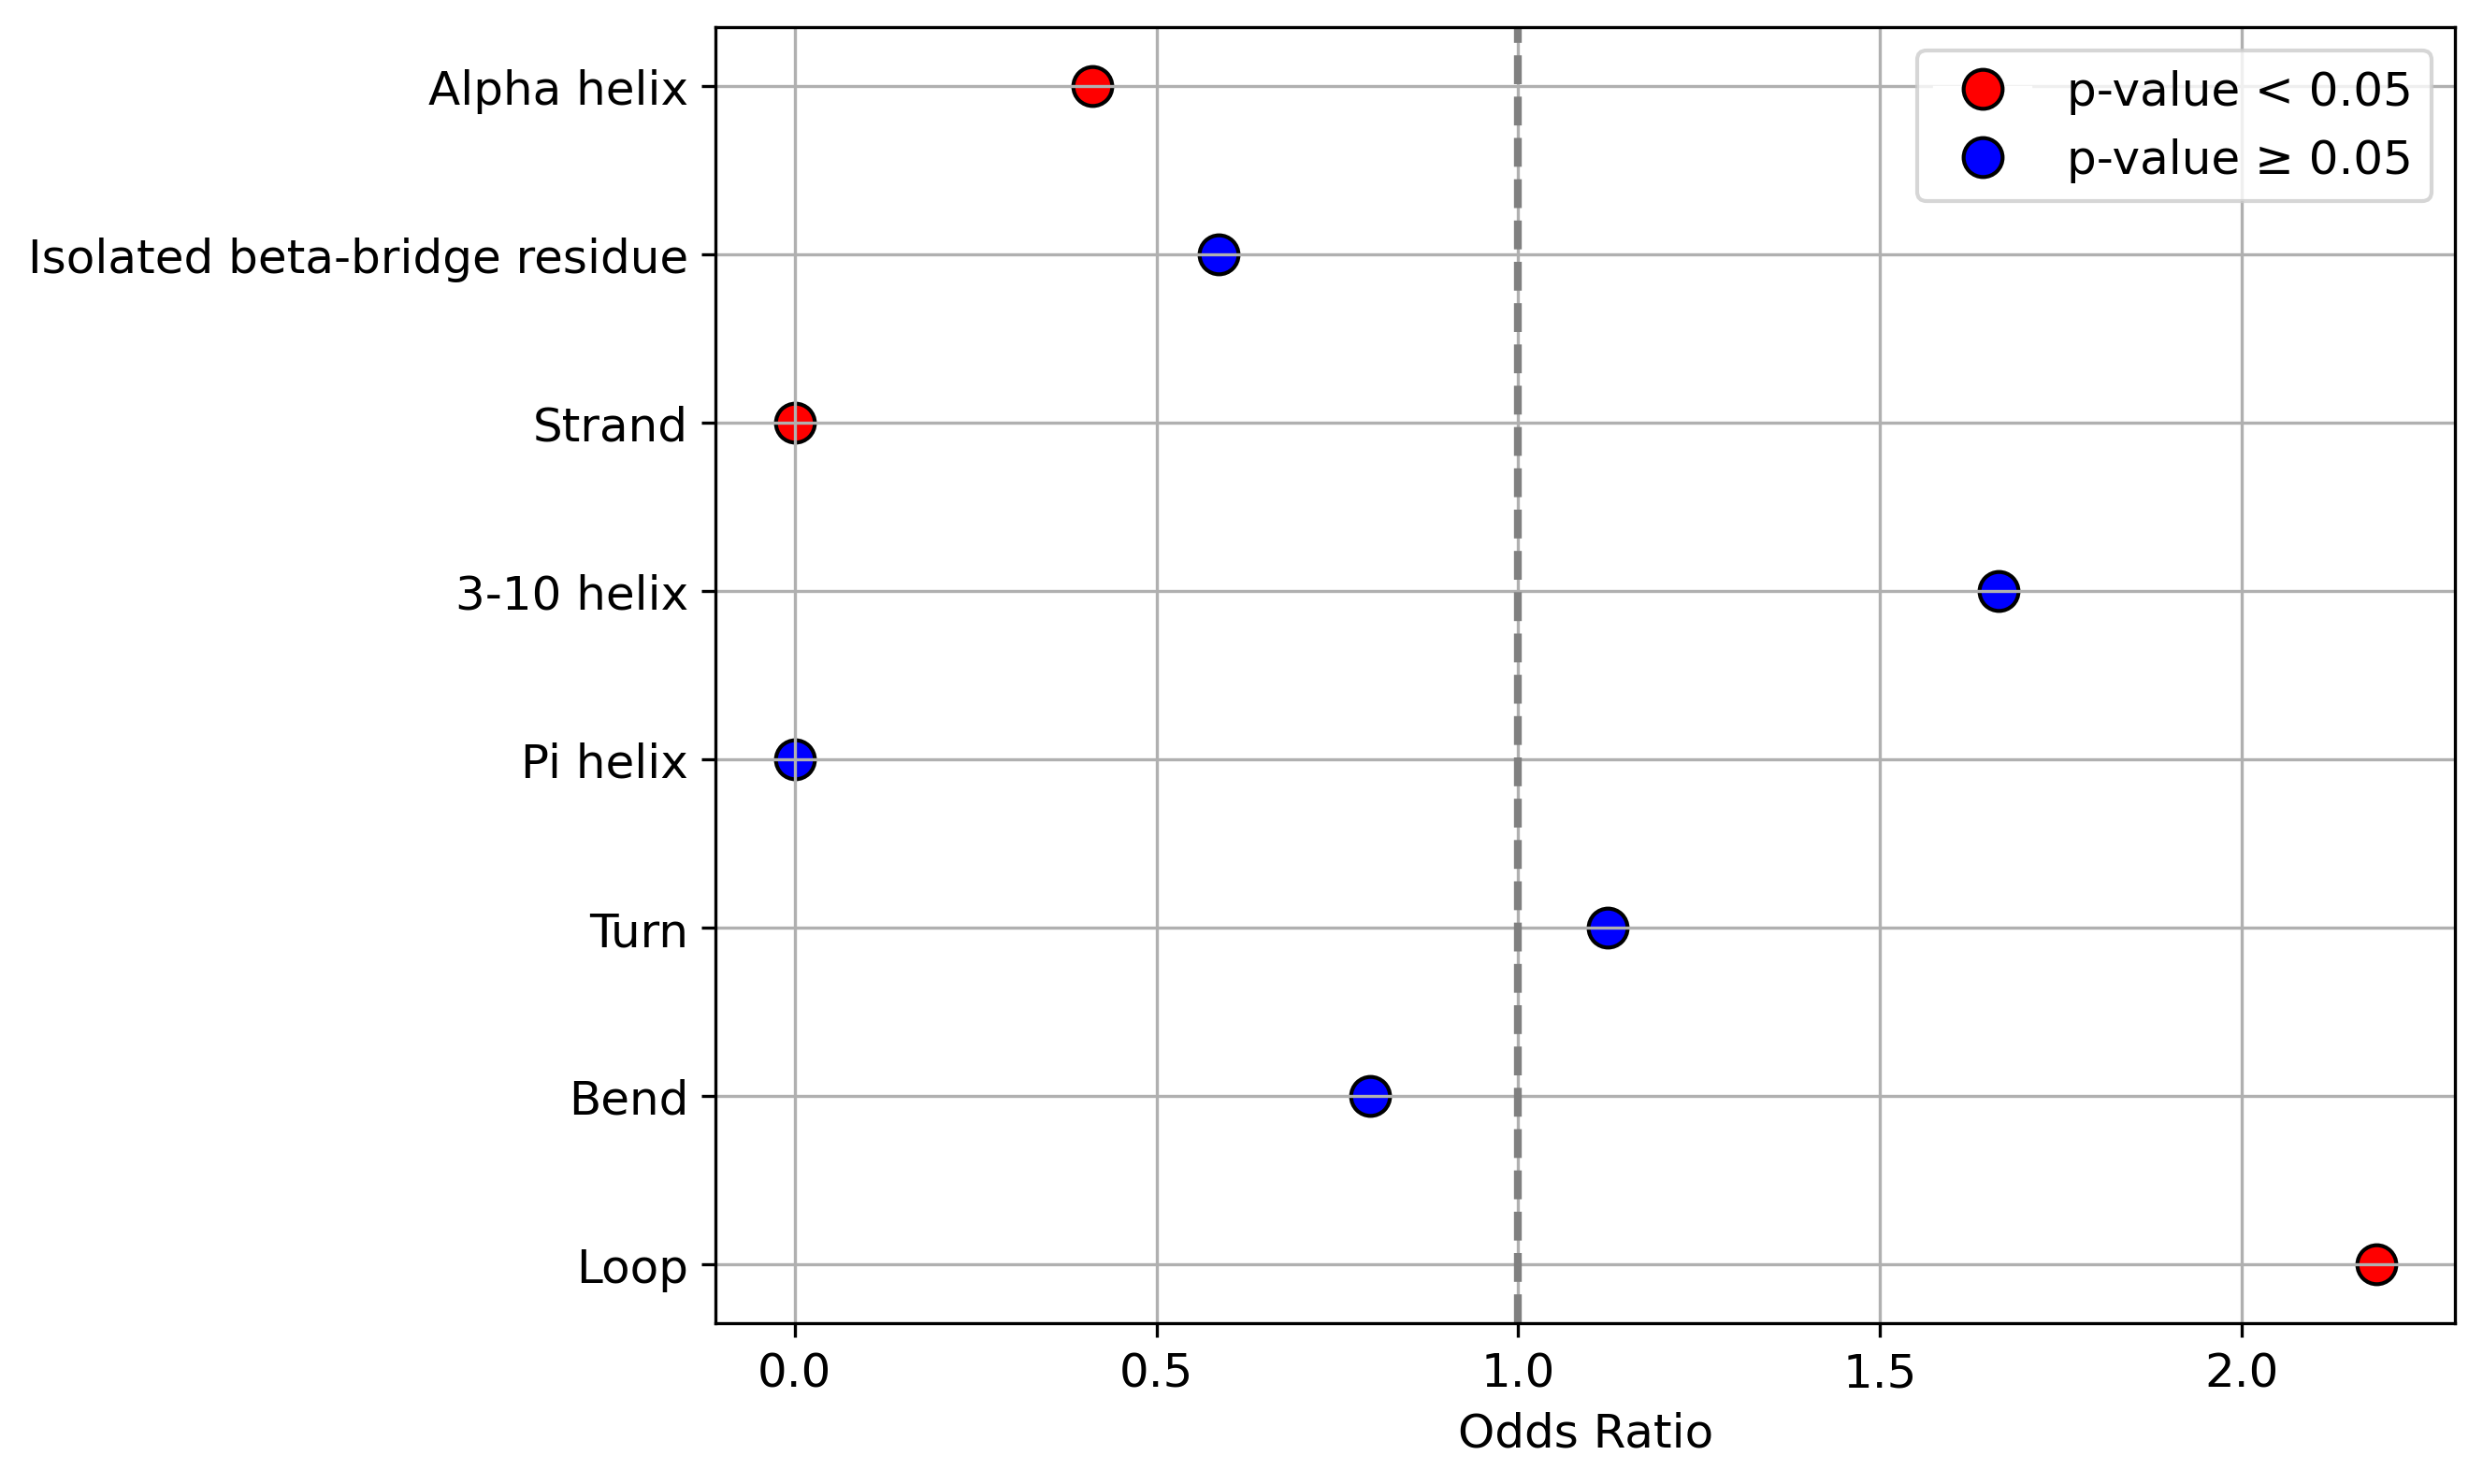 < < |
| Protein Feature Comparison of the relative accessible surface area (ASA) among the protiens. |
| ./stats/relative_asa/Q9H222-1_vs_Q9H222-2.png |
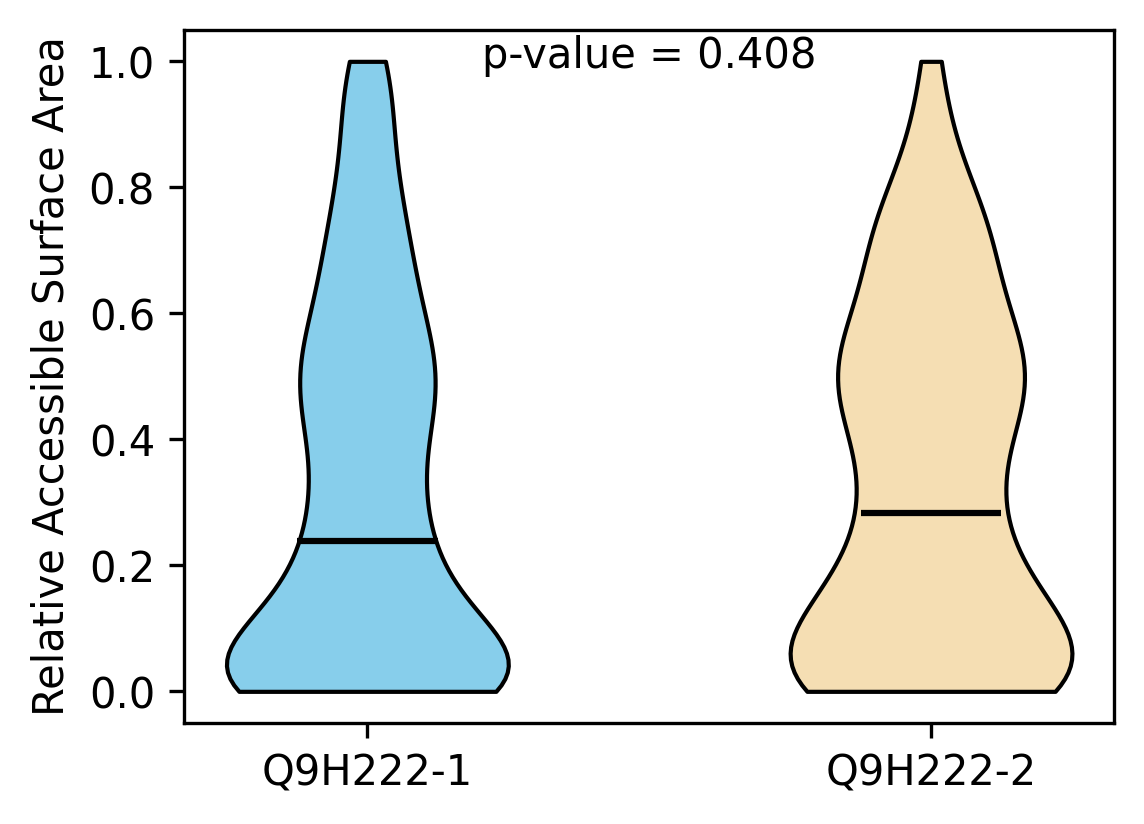 < < |
Protein-Protein Interaction |
| Interactors from UniProt. |
| Accession_id | Subsection | Start | End | Funcitonal feature | Splicing information |
| Interactors from STRING. |
| Gene name | Interactors |
Related Drugs to ABCG5 |
| Drugs targeting this gene/protein. (DrugBank) |
| UniProt accession | Gene name | DrugBank ID | Drug name | Drug group | Actions |
Related Diseases to ABCG5 |
| Previous studies relating to the alternative splicing of ABCG5 and disease information from the MeSH term (PubMed) |
| Gene | PMID | Title | Abstract | MeSH ID | MeSH term |
| ABCG5 | 20403997 | Genetic variation in 3-hydroxy-3-methylglutaryl CoA reductase modifies the chemopreventive activity of statins for colorectal cancer. | Genetic variation in 3-hydroxy-3-methylglutaryl CoA reductase (HMGCR), the rate-limiting enzyme in cholesterol synthesis, modifies the effect of statins on serum cholesterol levels. Long-term use of statins is associated with a reduced risk of colorectal cancer (CRC) in some, but not all, studies. We genotyped variants in 40 candidate genes important for cholesterol synthesis and metabolism in a population-based case-control study of CRC involving 2,138 incident cases and 2,049 population-based controls. We identified a single-nucleotide polymorphism in the HMGCR gene that significantly modified the protective association between statins and CRC risk. Compared with nonusers, the unadjusted odds ratio of CRC among statin users with the A/A genotype of rs12654264 in HMGCR was 0.3 (95% confidence interval, 0.18-0.51) and among statin users with the T/T genotype was 0.66 (95% confidence interval, 0.41-1.06; P-interaction = 0.0012). This genetic variant (A/A genotype of rs12654264) also was associated with lower serum levels of low-density lipoprotein among all cases and controls. In colon cancer cell lines, the reduction in cholesterol levels after statin treatment was substantially stronger in cells carrying the A/A genotype, and this difference was related to alternative splicing involving the HMGCR statin-binding domain. We anticipate that these data may advance the development of personalized statin use for reducing the risk of cancer as well as cardiovascular disease among the approximately 25 million people currently using statins worldwide. | D015179 | Colorectal Neoplasms |
Clinically important variants in ABCG5 |
| (ClinVar, 04/20/2024) |
| accession_id | uniprot_id | gene_name | Type | Variant | Clinical_significance |
 Copyright 2024-Present
The University of Texas Health Science Center at Houston (UTHealth Houston) Web File Viewing | Emergency Information |